
Theme Park Optimization
Exploring optimizing a collection of custom theme park attractions using a predictive model and constraint optimization

Intro
I have devoted my career to utilizing statistical analysis to answer questions and influence decisions pertaining to my top subject passions: entertainment and sports. To this date, I have primarily focused on the data-rich areas that are sports and movies. However, I had always had an eye on applying statistical frameworks to theme park analysis. Although theme park data is hard for someone in the public sector to acquire and use, it is a fascinating and lucrative business I am incredibly passionate about.
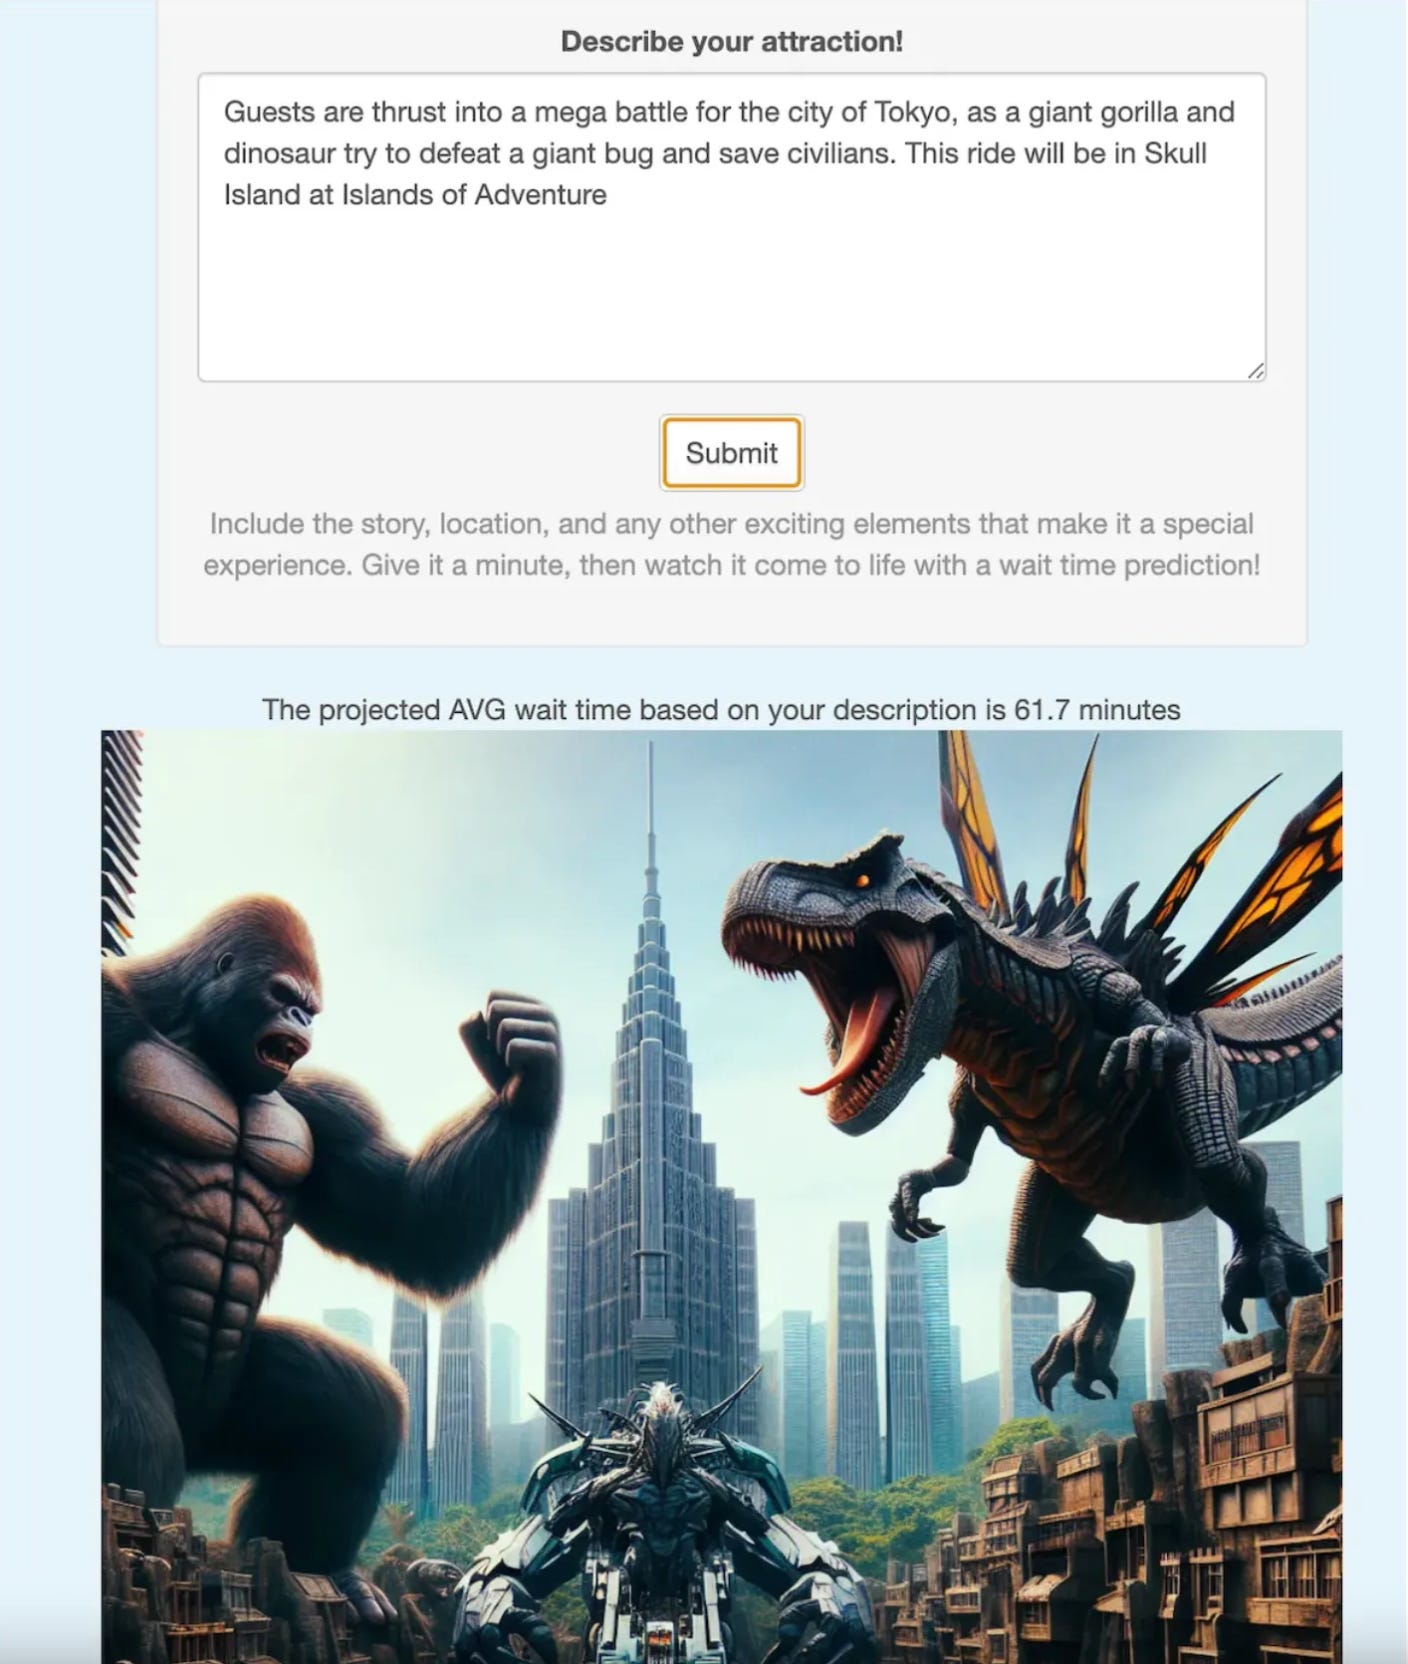
Starting in late 2019 (up until the 2020 shutdowns), I was able to download wait time data from laughingplace.com and started strategizing how to use it. As someone primarily focused on the creative aspects of theme parks, I prioritized using the wait time data to help with the creative ideation. My first project was a tool that allows the user to create a high concept of an attraction and receive a popularity prediction. This involved building a model to predict wait time based on a bunch of features about the attractions. Then, I used OpenAI’s text extraction tools to extract features from a user’s high concept and plug them into the predictive model. The result was a dashboard that looked like the following:
I wanted to expand this work, but I didn’t quite know how. However, inspired by NBCUniversal and Mattel working on building new parks, I wanted to see if my statistical model could be of use for anyone looking to build a new collection of attractions. My specialty at work is portfolio management for creative assets, and this was a test case for how to apply portfolio analysis to theme park attractions. So, I set out with the goal of building the optimal theme park.
Challenge
The first step of optimizing park construction was to find the target variable I need to optimize. This is more of a challenge than in other areas I’ve worked on. In sports, the goal is to win games. In movies, the goal is to receive direct revenue on your movie or portfolio of movies. These areas have direct responses and repeated feedback, and thus are easier to analyze. Theme parks are a lot more indirect with a huge proportion of revenue coming from guests paying a flat fee for entry, which made the task at hand difficult. The main goal is revenue, but the challenge is deciding which time horizon is most important and how to attribute revenue to the individual park features.
I decided I wanted to optimize the popularity of the collection of attractions, but had to pick a proper proxy for popularity. Ideally, I would probably select guest flow. This is a combination of attraction capacity and the number of guests who wait for it. However, I did not have capacity data, nor did I have data on how often the attractions are out of order. The only outcome measure I had access to was the wait time data I received. So, for this exercise, I set out to optimize guest waits with the assumption that higher wait time is a good representation for popular attractions (it’s likely a solid but far from perfect measure of popularity, as some popular attractions have high capacities which lead to lower waits).
Park Goal
I set up a custom park to create, which directed me on some of the features I used in the technical analysis. I made a high concept to give me some idea of the potential attraction options.
“Hollywood Dreams welcomes guests to the world of popular storytelling. Throughout history, humans have been telling stories of many kinds, but a few key topics have been huge drivers of these stories: Heroes, Magic, Human Action, and the world beyond Earth. In this park, guests get to experience these stories through the IP of major Hollywood studios Warner Bros. and Paramount. Guests will fight with their favorite DC superheroes, experience the magic of the Middle-Earth worlds of Westeros and Middle Earth, live through adventures with action heroes such as Ethan Hunt and Sonic the Hedgehog, and explore outer space with Paul Atreides and the Starship Enterprise crew”.
Although a very rudimentary vision for the park, it was adequate as a guide for setting up this analysis. As a park meant for everyone, I needed to make sure to have the right combination of attraction types that create options for all types of guests. I randomly generated custom attractions with combinations of the model features and used them as the options to select from. I have a massive backlog of potential attraction high concepts; some of them can be found here, but for the sake of this modeling exercise I just used the randomly generated ones. In a future iteration, I may use meticulously designed attractions.
Steps
My steps for creating this analysis were the following:
Trained model to predict wait times (mean, 5th percentile, 95th percentile) for existing attractions
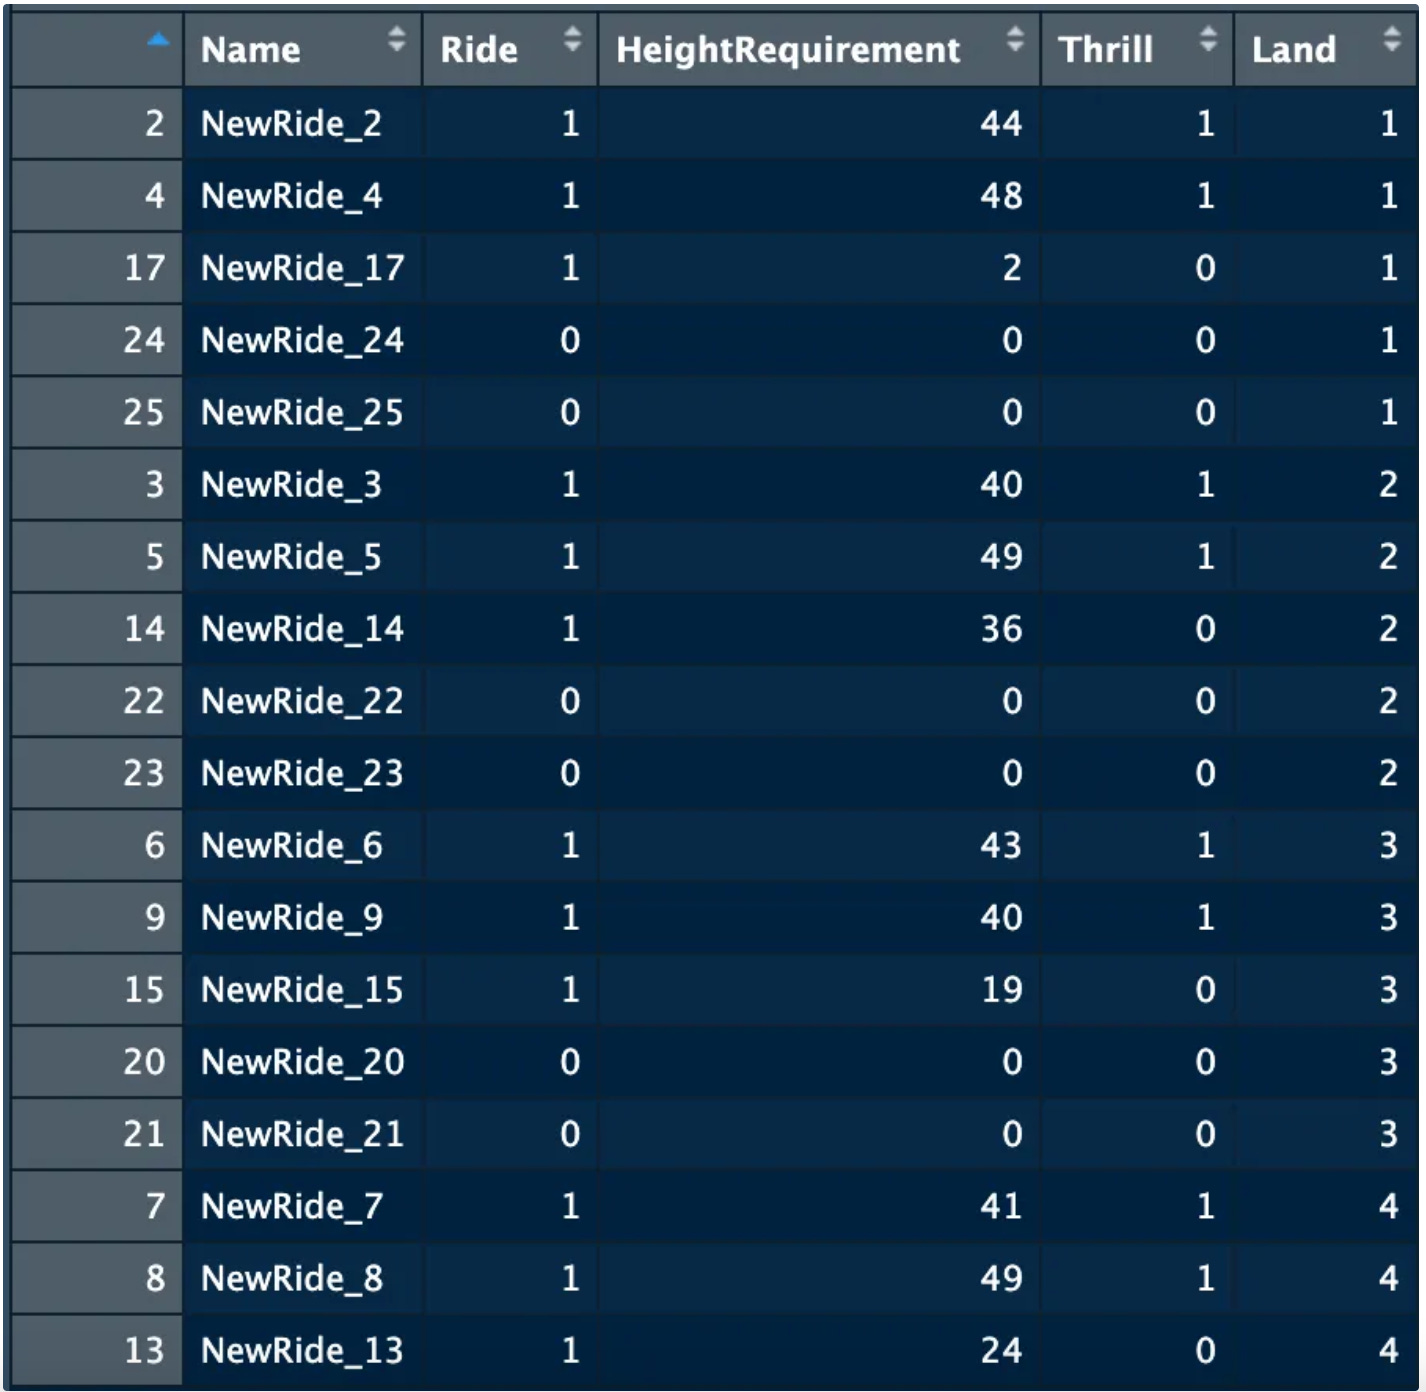
Created 30 new attraction options. 9 thrill rides, 9 rides with low to 0 height requirement, and 12 non-rides
None have Disney or Universal IP
Predicted wait times (mean, 5th percentile, 95th percentile) for new attractions
Set constraints for new park
Max 18 attractions
4 lands
Each land has max 3 rides and 2 non-rides
Max 2 thrill rides per land
Total height requirement sum for each land can’t exceed 1.1x the highest land height requirement sum in existing parks (Marvel Superhero Island)
Set up optimization to pick the best combination of the new attraction options that fit the constraints
I arbitrarily set the constraints, but these are generally determined by the company’s financial and time goals. This analysis was meant to be a shell framework that can be altered for the specific needs of the user.
Results
Total Predicted AVG Wait Time: 638.94 minutes, or 35.5 minutes per attraction
Takeaways
I took away a few key insights from this optimization run:
Once you find a target measure you want to optimize, you can create an optimization program using predictions of your target measure + constraints
Guest flow may be the best one, but I used wait time as a proxy for popularity since this was all I had
Ideally, an internal DS team will find a way to attribute attendance revenue to certain attractions and lands
Picking the right constraints is crucial. For theme parks, they include financial and spacial limits + diversification in attraction type options and guest demographics
Want a mix between slower things and some high-tech thrills
Popular IPs are strong drivers of popularity, and picking popular IP helps optimize the collection without affecting the constraints
The attractions that are projected to have the highest wait are thrill rides with strong IP (Harry Potter and Marvel). Finding comparable attractions are crucial for driving popularity of new parks
This process requires direction from creative experts to be truly useful, and also requires properly representing the uncertainty around the predictions to create an effective collection
Next Steps
I highlighted a few areas I’d like to add if I were to do a deeper version of this.
Optimize guest flow (using predicted wait time and capacity)
Need capacity data
Utilize process to choose optimal addition to existing park
Implement new IPs in predictions
Infer how popular the IPs I use would be (could be to use proxies for the Disney/Universal ones)
Implement tech, story, and theming features
Do rides with innovative tech get more popularity?
How much does theming (music, animatronics, etc) affect the outcomes?
Also, I could spend more time on generating the attractions through developed high concepts rather than randomly generated collection of features. This would be done through a blue sky ideation phase that factors in story, other features, and the interactions with the rest of the park much better.
Conclusion
This tool creates a framework that can help inform decisions on additions and replacements in a larger collection of theme park attractions. The more features it has, the better it will perform in creating the product we want. This is a process that can always be improved on, and is set up to implement direction from creative experts. This analytical process implements expertise and uncertainty, and is best used as part of a collective effort to creating a great collection of attractions.